MariaDB 10.6 is getting stable, and one of its features is JSON_TABLE. I was the code reviewer for it. Here are slides that cover JSON_TABLE from the user point of view. In this post, I wanted to share the experiences from implementing JSON_TABLE.
Contents:
- It’s all about JSON Path engine
- Supporting Table Function in query optimizer
- Name resolution rules for JSON_TABLE’s first argument
- JSON_TABLE is non-deterministic
It’s all about JSON Path engine
JSON_TABLE relies heavily on JSON Path engine. JSON_TABLE’s first argument is a JSON Path expression which points to JSON elements that will produce the JSON_TABLE’s “rows”. Then, there are JSON Path expressions which point to values of columns.
MariaDB had JSON parser and JSON Path evaluator before we started work on JSON_TABLE. They are integrated, there’s a single API to parse JSON document and locate the nodes pointed by a JSON Path expression. JSON_TABLE has a “primary” parser/path evaluator object to enumerate JSON elements for its “rows”. For each row, the primary parser/path evaluator is forked, and the fork(s) are used to compute the values of column(s). This means, there is double parsing of JSON structures. On the other hand, no in-memory structures are built, so memory footprint is low.
Supporting Table Functions in query optimizer
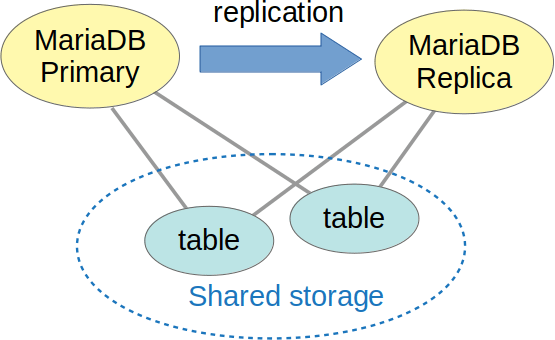
JSON_TABLE’s argument can refer to columns of other tables. That is, the contents of the JSON_TABLE’s table change depending on the current rows of other tables . This puts some limitations of where JSON_TABLE can be put in the query plan. This is similar to LATERAL derived tables (which MariaDB doesn’t support, yet).
Fortunately for the optimizer, there are some syntactic restrictions about JSON_TABLE’s argument that prevent one from creating complex and/or invalid dependencies with use of JSON_TABLE.
Name resolution rules for JSON_TABLE’s argument
Basically, JSON_TABLE’s argument can only contain references to tables that “precede” the JSON_TABLE in the FROM clause:
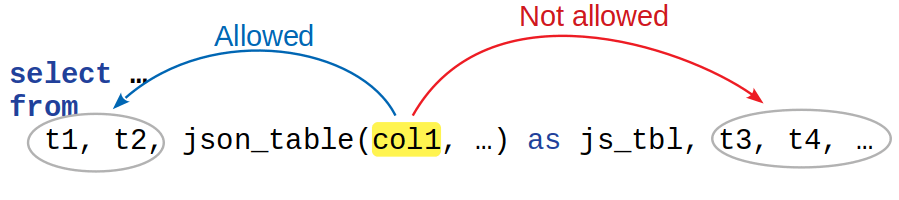
This rules out things like circular dependencies between multiple JSON_TABLE(…) invocations or JSON_TABLE’s dependencies being in conflict with LEFT JOIN dependencies.
RIGHT JOIN is trickier. MariaDB follows MySQL’s approach and declares that for RIGHT JOIN, we assume that it’s outer side “precedes” the inner side. This way, one can’t write a query with a dependency loop. Oracle 18c accepts queries with conflicting dependencies like “t1 RIGHT JOIN JSON_TABLE(t1.col)” (example in fiddle), but I don’t know what semantics it has for them.
JSON_TABLE is non-deterministic
This was discovered fairly late in development by Elena Stepanova. Let’s define a non-deterministic function as: function that may return non-equivalent values for equivalent inputs.
Then, let’s consider two JSON documents. As far as JSON data model goes, they are identical:
set @doc1= '{"color": "black", "price": 100    }';
set @doc2= '{"price": 100,     "color": "black"}';
and consider this JSON_TABLE call:
select * from
json_table(@doc, '$.*' columns (id for ordinality,
                                val varchar(10) path '$')) as JT;
In MariaDB, this produces 1-black, 2-100 for @doc1 and 1-100,2-black for @doc2. This is because MariaDB computes JSON Path in a streaming fashion and ‘$.*’ returns object members in the order they appear in the JSON document.
MySQL, on the other hand, will return 1-100,2-black for both documents. This is because it parses the JSON and orders members by name before computing JSON Path.
Both seem to be valid, but then JSON_TABLE is not a “function” in mathematical sense.